|
LandVision™ Help > Documentation > Demographic Data
|
|
LandVision™ provides you with a rich resource for Demographic Data and the tools to use it effectively. Pre-defined styles provide you with customized maps of Demographic Data. To fit your specific needs, you can copy and modify any pre-defined style to create a new style. You can also create custom searches with Demographic Data search filters. Your search results enable you to expand the uses of Demographic Data.
Note: LandVision™ US Census Bureau Demographic Data that is aggregated at the block group level; the US Census Bureau provides three levels of Demographic Data:
- Block: A statistical area bounded by visible features, such as streets, roads, streams, and railroad tracts, and by non-visible boundaries, such as selected property lines and city limits. A block is the smallest geographic unit for which the US Census Bureau tabulates 100-percent data.
- Block Group: Generally contains between 600 and 3,000 people. It is the smallest geographic unit for which the US Census Bureau tabulates sample data. Block Group is a statistical subdivision of a tract.
- Tract: Contains on average about 4,000 inhabitants. A small, relatively permanent statistical subdivision of a county.
|
Identifying the Demographic Data Layer
|
LandVision™ contains many powerful pre-defined demographic styles. Here are just a few of the styles based on income: Med. Income – Working Class, Income – Upper Class, Med. Age And Income – Generation X, Med. Household Income, Income and Males, Income and Females, etc. Each is a visual theme that provides market insights. |
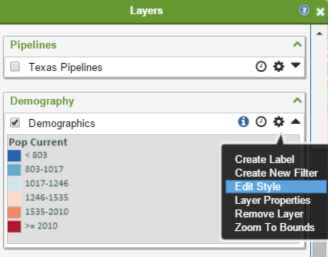 |
- Turn on the Demographics layer by clicking on the layer in the Legend. The blue check means the layer is turned on. Demographics is the default Demographic Data layer.
- Click the Options icon
 on the Demographics Data Layer. on the Demographics Data Layer.
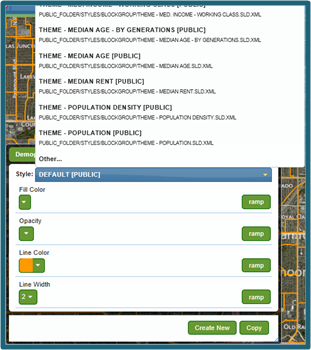
- Click Edit Style in the menu. The Style Editor appears.
- Click the Style drop-down list to select a style (See Thematic Mapper in Related Documents for information about styling data).
Tip: To scroll through the styles in the Style drop-down list one at a time, use the up and down arrow keys on your keyboard.
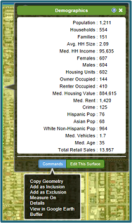
- Click on any Block Group on the map to view its Demographic Data. The Demographic Data window opens.
- Click the Command button for a variety of Demographic Data options (See Commands Menu Options below for more information).
|
|
Here's How to copy a pre-defined Demographic style:
- Select the style which you’d like to copy in the Style drop-down list of the Style Editor.
- Click the Copy button
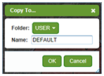
 at the bottom of the Style Editor. The Copy To… window opens. at the bottom of the Style Editor. The Copy To… window opens.
- Select the Folder to save the copy of the style.
- Enter a new Name for the style. You must change the name of the original style to copy to the folder it is saved in. The style name does not support special characters. It supports upper and lower case letters, spaces and underscores.
Tip: Select another folder if you’d like to save a copy of the original style without changing its name.
- Click the OK button. The copy of the style appears in the Style drop-down menu. You can now format the visual attributes of the style if desired.
|
Searching for Demographic Block Groups
|
LandVision™ enables you to create custom searches with Demographic Data search filters. Your search results enable you to expand the uses of Demographic Data, as follows:
- Create a tabular listing of your search results in the Results List (See Related Documents).
- Save the Results List for future reference.
- Export the Results List as a csv file to use in a spreadsheet.
- Create the layer from the Results List and then style it using Thematic Mapper (See Related Documents).
Note: Your search results dynamically update as you pan, zoom in or zoom out of the map. |
- Click the Search icon from the Main Toolbar. The Search Filter window appears.
- Select Demographics
 from the Search drop-down list. The window displays nine categories of Demographic Data search filters (See below for definitions). from the Search drop-down list. The window displays nine categories of Demographic Data search filters (See below for definitions).
- Select your desired search filter criteria.
- Click OK to run your Demographic Data search. Your search results appear on the map as Block Groups and are counted in the Search Results box.
Tip: Use the Search Filter Bar to quickly adjust your search filter criteria. It is below the Main Toolbar. Hover over a tab such as Income, to open a drip-down list with search filter criteria. An inactive filter becomes active when you click on criteria, or click the check box.
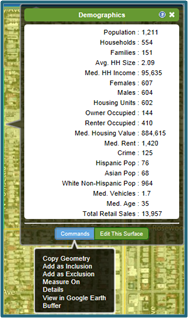
- Click on any Block Group to view its Demographic Data. The Demographic Data window opens.
|
 |
- Click the Command button for a variety of Demographic Data options (See Commands Menu Options below for more information).
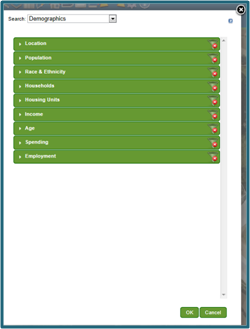
The LandVision™ Demographic Data search filter categories are Location, Population, Race & Ethnicity, Households, Housing Units, Income, Age, Spending, and Employment.
Note: To toggle off or on search criteria, click the check box. To set the values for some criteria, click and drag either end of the slider.
|
|
Commands Menu Options
|
Copy Geometry: Copies your identified Block Group's geometry to another layer.
Add as Inclusion/Exclusion: See Related Documents.
Measure On: See Related Documents.
Details: Displays more information about your identified Demographic Block Group.
View in Google Earth: See Related Documents.
Buffer: Creates a custom search area around your identified Demographic Block Group. |
 |
Related Documents
|