|
LandVision™ Help > Documentation > Traffic Counts
|
|
Landvision™ provides Department of Transportation traffic data as a nationwide data set.
Whether you are looking for properties with high traffic around them to increase visibility, or are looking for low traffic counts for ease of access to a property, LandVision™ Traffic Counts will cover your needs.
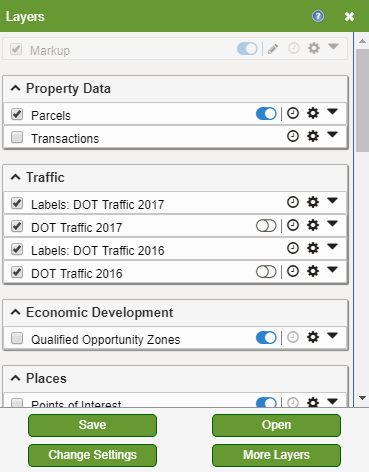
Look for the "DoT Traffic" layer in your layers panel to get an idea of the traffic volume nearby the properties that you are looking at.
|
Traffic Count Layers
|
The Traffic Count layers behave similarly to the dataset layers you are already familiar with in LandVision.
They can be moved in the Layers Panel to place them in the order that makes them easiest for you to find based on your needs.
For more information on how to use Layers in LandVision, Click Here
|
|
|
LandVision Traffic Count layers also come pre-styled for ease of use right from the start.
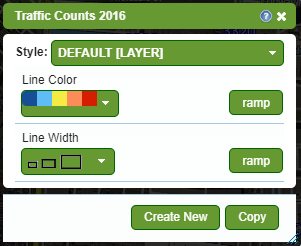
By default, the AADT (Annual Average Daily Traffic) counts are represented by different colors on the map.
|
|
|
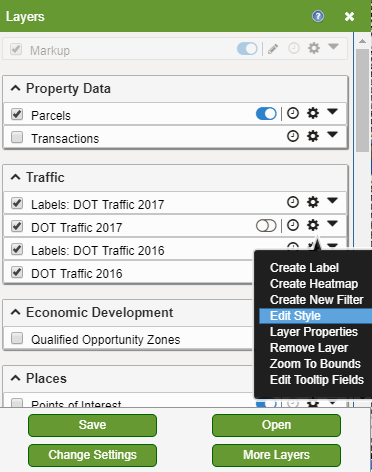
However you can customize their look and feel by simply using the Edit Style option for both the Traffic Counts data layer as well as the Traffic Counts Label layer.
For more information on how to style Layers in LandVision, Click Here
|
|
|
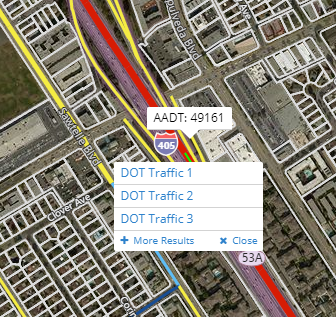
The Traffic Counts data layer also has the familiar Tooltip popup that by default will show the "Annual Average Daily Traffic" for that roadway.
As with any Tooltip, this can be customized to show other or more detail that is available on that layer.
|
|
|
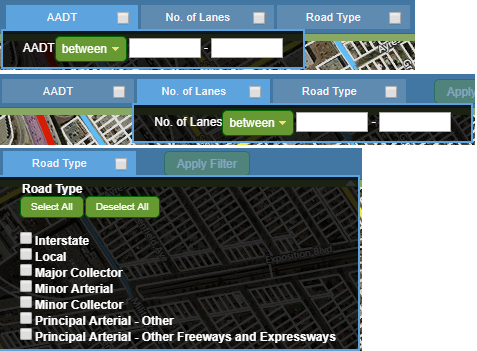
The Traffic Counts layer can also be searched to look for target properties with two built-in filters.
The AADT or Annual Average Daily Traffic filter can be used to find roadways with a specified traffic count.
For Example: AADT = 10000 The No. of Lanes filter will let you search for roadways with a specified amount of lanes.
For Example: No. of Lanes = 4 The Road Type filter will let you search for roadways based on how they are classified
For Example: Road Type = Interstate
|
|
Related Documents
|

