|
LandVision™ Help > Documentation > Styling Your Map
|
|
Visual map analysis is an art that can easily be mastered in LandVision. The map styling tools enable you to visually distinguish the important attributes of your data. The value of your data increases as trends and insights become visible on the map. Learn how to style your data/layers in LandVision to get the most o
|
Classifying Data Overview
|
Once you import a data set into LandVision™, you can work with it as a layer. You can style the visual attributes for a layer (i.e.; fill color, opacity, image type, image color, image size, etc.) in two primary ways: unclassified and classified
|
|
|
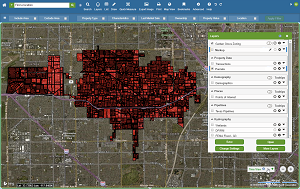
- Unclassified Data: When you first view your data in LandVision™, it is unclassified. Unclassified data means the style doesn't vary at all even though the field values do vary. In the example to the right, the Zoning layer is unclassified, meaning all the polygons are given the same red color.
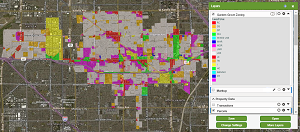
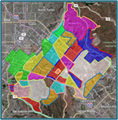
- Classified Data: Classifying your data allows you to define a variety of styles for your fields, depending on the values contained in that field. For example, if you have a City Zoning layer, you can classify that layer and have the fill color tied to Land Use code. This allows you to quickly identify patterns in the data, and determine which area falls within a specific zone or land use.
|
|
|
Styling Data Overview
|
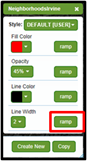
The Style Editor enables you to style the visual attributes of unclassified data, and the Ramp Editor enables you to classify your data, and define style rules for your classified data.
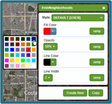
To style the visual attributes of unclassified data, use the drop-down menus on the left side of the Style Editor. In the example to the right, red fill color is being changed to blue from the Fill Color menu.
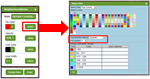
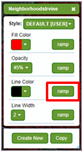
To open the Ramp Editor so that you can classify an attribute of your data, such as Fill Color, click the Ramp button  to the right of the attribute. to the right of the attribute.
|
 |
|
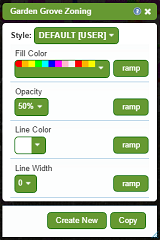
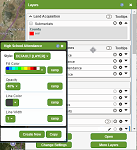
To open the Style Editor, see Creating a New Style below. The Style Editor includes these features:
|
- Style drop-down menu: Select a style to tie to your layer (data set) and/or edit. The menu lists all available styles for your layer. All layers are created with a style named Default, which is automatically saved in the User folder. The first time you work with a layer, the only style available in the drop-down menu is Default [USER].
Note: To select a style using a path, click Other... on the drop-down menu.
- Create New: Create a new style.
- Copy: Copy the style displayed in the Style drop-down menu, and create as a new style.
Tip: To scroll through the styles in the Style drop-down menu one at a time, use the up and down arrow keys on your keyboard. |
 |
Styling Polygon Layers
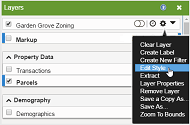
- Click the Options icon
 to the right of your polygon layer name in the Layers Panel. to the right of your polygon layer name in the Layers Panel.
- Click Edit Style in the menu. The Style Editor opens.
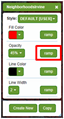
There are four options for a polygon layer: Fill Color, Opacity, Line Color, and Line Width. The sections below explain how to style these visual attributes for polygon layers in two primary ways: unclassified and classified. (See Classifying Data Overview above for more information.)
|
 |
Styling Unclassified Polygon Layers
To change the visual attributes of unclassified data, use the drop-down menus on the left side of the Style Editor.
Fill Color: Click the down arrow to open the fill color menu. Select the fill color by clicking on a color swatch. Your selected fill color appears in the Style Editor, and becomes the fill color of your polygon layer.
Opacity: Select the opacity of the fill color from the drop-down menu. The range of opacity is 0% (no fill color visible) to 100% (solid fill color). A fill color with 0% opacity is not visible on the map. Your selected opacity percent appears in the Style Editor, and is applied to the fill color of your polygon layer.
Line Color: Click the down arrow to open the line color menu. Select the line color by clicking on a color swatch. Your selected line color appears in the Style Editor, and the lines of your polygon layer.
Line Width: Select the line width from the drop-down menu. Your selected line width appears in the Style Editor, and is applied to the lines of your polygon layer. |
|
Styling Classified Polygon Layers
Classifying on Fill Color
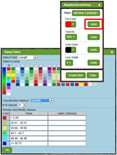
- Click the ramp button for Fill Color. The Ramp Editor opens.
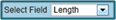
- Select the field you want to tie the style variation to from the Select Field drop-down menu
 . .
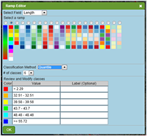
- Click the radio button above a color ramp to select it.
Note: Depending on the type of data contained in the selected field, the Ramp Editor displays stepped ramps, or a combination of stepped and smooth ramps.
|
 |
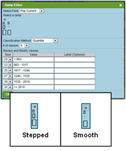
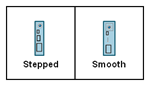
Stepped and Smooth Ramps Overview
The type of ramp that you choose is an important part of the visual classification scheme of your data, and the effectiveness of your analysis. It determines the classification methods that you can select.
Stepped ramps are composed of individual color swatches. Each color swatch has a different value. The colors in smooth ramps are blended together.
Stepped ramps and smooth ramps have different classification methods:
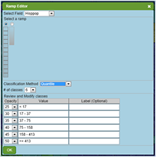
- Stepped Ramps: In the Ramp Editor, you must select a Classification Method and # of Classes for stepped ramps. There are four types of classification methods. Each method classifies data in a different way. Selecting the best method for your data set optimizes your data classification. The # of Classes you select determines the range of values represented by the individual color swatches of a stepped ramp. It is the best practice to select 5 to 7 classes for a stepped ramp. (See Tips on Classifying Data below for more information.)
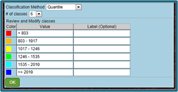
In the Ramp Editor, the Review and Modify Classes table populates based on your selected Classification Method and # of Classes. You can make modifications in the table if desired, such as changing individual colors of your selected ramp.
- Smooth Ramps: Select a smooth ramp if you'd like to visually differentiate a wide range of values on the map. In the Ramp Editor, the Classification Method and # of Classes are grayed out. They do not apply to smooth ramps. The Review and Modify Classes table automatically populates with three color swatches, and the minimum, median, and maximum field values for your selected smooth ramp. You can make modifications in the table if desired, such as changing a color.
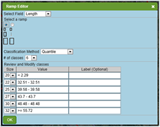
Stepped Ramps
For a Stepped Ramp selection, you must select a Classification Method and # of Classes.
Classification Method and # of Classes
- Classification Method: Select Natural Breaks, Distinct,
Quantile, or Equal Interval from the drop-down menu
 (See Tips on Classifying Data below for definitions and tips). (See Tips on Classifying Data below for definitions and tips).
- # of Classes: Select the number of classes from the drop-down menu
 . .
Tip: The # of Classes sets the number of value ranges that have a distinct color. It is the best practice to select 5 to 7 classes. If you select too many classes, it is generally difficult to gain insight from the color scheme on the map. If you would like to visually differentiate many classes, use a smooth color ramp. (See Tips on Classifying Data below for more tips).
|
Review and Modify Classes Table
The Review and Modify Classes table enables you to try out different classification schemes before applying one:
- Based on your choice of Classification Method and # of classes, the Review and Modify Classes table populates with the fill color, value, and label for your selected data field.
- To further modify your classification scheme, you can make these selections in the table:
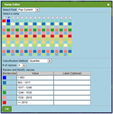
- Color: Click on any ramp color to change it. The Color Selector opens (See Tips for Using the Color Selector below).
- Value: Click a value to enter a new left end-point in the Edit Value window.
- Label (Optional): Type a label for any data value. The Legend displays your label instead of the value.
To apply your classification scheme, click the OK button at the bottom of the Ramp Editor. The Fill Color button  in the Style Editor displays your selected ramp. in the Style Editor displays your selected ramp.
|
|
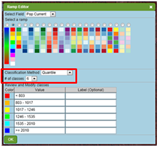
Smooth Ramps
The Classification Method and # of Classes do not apply to smooth ramps. They are grayed out.
You can modify the attributes in the Review and Modify Classes table if desired:
- Color: Click on any ramp color to change it. The Color Selector opens (See Tips for Using the Color Selector below).
- Value: Click a value to edit it in the Edit Value window.
- Label (Optional): Type a label for any data value. The Legend displays your label instead of the value.
To apply your classification scheme, click the OK button at the bottom of the Ramp Editor. The Fill Color button in the Style Editor displays your selected ramp.
|
|
Classifying on Opacity
Note: The Opacity and Fill Color options work together. A fill color with 0% opacity is not visible on the map. The range of opacity is 0% (no fill color visible) to 100% (solid fill color).
- Click the ramp button for Opacity. The Ramp Editor opens.
- Select a field you want to tie the style variation to from the Select Field drop-down menu .
- Click the radio button above an opacity ramp to select it.
Note: Depending on the type of data contained in the selected field, the Ramp Editor might display two types of ramps: stepped and smooth.
- Select a Classification Method and # of Classes. Based on your choices, the Review and Modify Classes table populates with the opacity, value, and label for your classified data field. (See Tips on Classifying Data below for definitions and tips.)
Note: Classification Method and # of Classes do not apply to smooth ramps. They are grayed out.
- In the Review and Modify Classes table, you can change the opacity assigned to your classes, click a value to edit the left end-point, or type a label for any data value. (The Legend displays your label instead of the value.)
To apply your classification scheme, click the OK button at the bottom of the Ramp Editor. The Opacity button in the Style Editor displays your selected ramp.
|
|
Classifying on Line Color
Note: Line color is the same as border color. It is not recommended that you classify on line color for adjacent polygon layers because the line colors of adjacent polygons overwrite one-another. This causes the loss of some of your classifications. |
 |
- Click the ramp button for Line Color. The Ramp Editor opens.
- Select a field you want to tie the style variation to from the Select Field drop-down menu .
- Click the radio button above a line color ramp to select it.
Note: Depending on the type of data contained in the selected field, the Ramp Editor might display two types of ramps: stepped and smooth.
|
 |
- Select a Classification Method and # of Classes. Based on your choices, the Review and Modify Classes table populates with the bordercolor, value, and label for your classified data field. (See Tips on Classifying Data below for definitions and tips.)
Note: Classification Method and # of Classes do not apply to smooth ramps. They are grayed out.
- In the Review and Modify Classes table, you can click on any Bordercolor to change it, click a value to edit the left end-point, or type a label for any data value. (The Legend displays your label instead of the value.)
Tip: When you click on a Bordercolor, the Color Selector opens. See Tips for Using the Color Selector below for more information.
To apply your classification scheme, click the OK button at the bottom of the Ramp Editor. Each polygon on the map is assigned a border color from your selected ramp. The Line Color button in the Style Editor displays the ramp. |
|
Classifying on Line Width
Note: It is not recommended that you classify on line width for adjacent polygon layers because the line widths of adjacent polygons overwrite one-another. This causes the loss of some of your classifications.
- Click the ramp button for Line Width. The Ramp Editor opens.
- Select a field you want to tie the style variation to from the Select Field drop-down menu .
- Click the radio button above a line width ramp to select it.
Note: Depending on the type of data contained in the selected field, the Ramp Editor might display two types of ramps: stepped and smooth.
- Select a Classification Method and # of Classes. Based on your choices, the Review and Modify Classes table populates with the size, value, and label for your classified data field. (See Tips on Classifying Data below for definitions and tips.)
Note: Classification Method and # of Classes do not apply to smooth ramps. They are grayed out.
- In the Review and Modify Classes table, you can change the size of the line width assigned to your classes, click a value to edit it, or type a label for any data value. (The Legend displays your label instead of the value.)
Tip: It is best practice to limit line width to a size range of no more than 1 - 12.
To apply your classification scheme, click the OK button at the bottom of the Ramp Editor. The Line Width button  in the Style Editor displays your selected ramp. in the Style Editor displays your selected ramp.
|
|
Styling Point Layers
- Click the Options icon to the right of your point layer name in the Legend.
Note: The Legend shows the current layer style below the layer name. New layers are unclassified as the default style.
- Click Edit Style in the menu. The Style Editor opens.
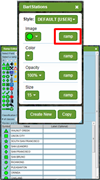
There are four options for a point layer: Image, Color, Opacity, and Size. The sections below explain how to style these visual attributes for point layers in two primary ways: unclassified and classified. (See Classifying Data Overview above for more information.)
|
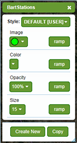 |
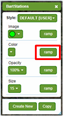
Styling Unclassified Point Layers
To change the visual attributes of unclassified data, use the drop-down menus on the left side of the Style Editor.
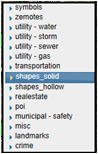
Image: Select an image from the drop-down menu. Your selected image appears in the Style Editor, and becomes the image for all the points in your point layer.
Color: Click on a color swatch in the drop-down color menu. Your selected color appears in the Style Editor, and becomes the color for all the images in your point layer.
Opacity: Select the opacity of the image color from the drop-down menu. The range of opacity is 0% (no fill color visible) to 100% (solid fill color). A color with 0% opacity is not visible on the map. Your selected opacity percent appears in the Style Editor, and is applied to the color of all the images in your point layer.
Size: Select the image size from the drop-down menu. Your selected size appears in the Style Editor, and is applied to all the images in your point layer. |
 |
Styling Classified Point Layers
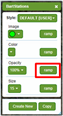
Classifying on Image
- Click the ramp button for Image. The Ramp Editor opens.
- Select a field you want to tie the style variation to from the Select Field drop-down menu
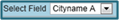 . .
- Click the radio button above an image ramp to select it.
- Select a Classification Method and # of Classes. Based on your choices, the Review and Modify Classes table populates with the symbol, value, and label for your classified data field. (See Tips on Classifying Data below for definitions and tips.)
- In the Review and Modify Classes table, you can click on any symbol to change it, click a value to edit it, or type a label for any data value. (The Legend displays your label instead of the value.)
To apply your classification scheme, click the OK button at the bottom of the Ramp Editor. The Image button  in the Style Editor displays your selected ramp. in the Style Editor displays your selected ramp.
|
 |
Classifying on Color
- Click the ramp button for Color. The Ramp Editor opens.
- Select a field you want to tie the style variation to from the Select Field drop-down menu .
- Click the radio button above a point color ramp to select it.
Note: Depending on the type of data contained in the selected field, the Ramp Editor might display two types of ramps: stepped and smooth.
|
|
- Select a Classification Method and # of Classes. Based on your choices, the Review and Modify Classes table populates with the color, value, and label for your classified data field. (See Tips on Classifying Data below for definitions and tips.)
Note: Classification Method and # of Classes do not apply to smooth ramps. They are grayed out.
- In the Review and Modify Classes table, you can click on any color to change it, click a value to edit it, or type a label for any data value. (The Legend displays your label instead of the value.)
Tip: When you click on a color, the Color Selector opens. See Tips for Using the Color Selector below for more information.
To apply your classification scheme, click the OK button at the bottom of the Ramp Editor. The Color button in the Style Editor displays your selected ramp. |
Classifying on Opacity
Note: The Opacity and Color options work together. A fill color with 0% opacity is not visible on the map. The range of opacity is 0% (no color visible) to 100% (solid color).
- Click the ramp button for Opacity. The Ramp Editor opens.
- Select a field you want to tie the style variation to from the Select Field drop-down menu .
- Click the radio button above an opacity ramp to select it.
Note: Depending on the type of data contained in the selected field, the Ramp Editor might display two types of ramps: stepped and smooth.
- Select a Classification Method and # of Classes. Based on your choices, the Review and Modify Classes table populates with the opacity, value, and label for your classified data field. (See Tips on Classifying Data below for definitions and tips.)
Note: Classification Method and # of Classes do not apply to smooth ramps. They are grayed out.
- In the Review and Modify Classes table, you can change the opacity assigned to your classes, click a value to edit the left end-point, or type a label for any data value. (The Legend displays your label instead of the value.)
To apply your classification scheme, click the OK button at the bottom of the Ramp Editor. The Opacity button in the Style Editor displays your selected ramp.
|
|
Classifying on Size
- Click the ramp button for Size. The Ramp Editor opens.
- Select a field you want to tie the style variation to from the Select Field drop-down menu.
- Click the radio button above a ramp to select it.
Note: Depending on the type of data contained in the selected field, the Ramp Editor might display two types of ramps: stepped and smooth.
- Select a Classification Method and # of Classes. Based on your choices, the Review and Modify Classes table populates with the size, value, and label for your classified data field. (See Tips on Classifying Data below for definitions and tips.)
Note: Classification Method and # of Classes do not apply to smooth ramps. They are grayed out.
- In the Review and Modify Classes table, you can change the size of the symbol assigned to your classes, click a value to edit it, or type a label for any data value. (The Legend displays your label instead of the value.)
To apply your classification scheme, click the OK button at the bottom of the Ramp Editor. The Size button in the Style Editor displays your selected ramp.
|
|
Styling Line Layers
- Click the Options icon to the right of your line layer name in the Legend.
Note: The Legend shows the current layer style below the layer name (the blue square in the example to the right). New layers are unclassified as the default style.
- Click Edit Style in the menu. The Style Editor opens.
There are two options for a line layer: Line Color and Line Width. The sections below explain how to style these visual attributes for line layers in two primary ways: unclassified and classified. (See Classifying Data Overview above for more information.)
|
|
Styling Unclassified Line Layers
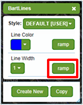
To change the visual attributes of unclassified data, use the drop-down menus on the left side of the Style Editor.
Line Color: Click the down arrow to open the line color menu. Select the line color by clicking on a color swatch. Your selected line color appears in the Style Editor, and the lines of your line layer.
Line Width: Select the line width from the drop-down menu. Your selected line width appears in the Style Editor, and is applied to the lines of your line layer.
Styling Classified Line Layers
Classifying on Line Color
- Click the ramp button for Line Color. The Ramp Editor opens.
- Select a field you want to tie the style variation to from the Select Field drop-down menu
 . .
- Click the radio button above a line color ramp to select it.
Note: Depending on the type of data contained in the selected field, the Ramp Editor might display two types of ramps: stepped and smooth.
- Select a Classification Method and # of Classes. Based on your choices, the Review and Modify Classes table populates with the color, value, and label for your classified data field. (See Tips on Classifying Data below for definitions and tips.)
Note: Classification Method and # of Classes do not apply to smooth ramps. They are grayed out.
- In the Review and Modify Classes table, you can click on any color to change it, click a value to edit it, or type a label for any data value. (The Legend displays your label instead of the value.)
Tip: When you click on a color, the Color Selector opens. See Tips for Using the Color Selector below for more information.
To apply your classification scheme, click the OK button at the bottom of the Ramp Editor. The Line Color button in the Style Editor displays your selected ramp.
|
 |
Classifying on Line Width
- Click the ramp button for Line Width. The Ramp Editor opens.
- Select a field you want to tie the style variation to from the Select Field drop-down menu .
- Click the radio button above a line width ramp to select it.
Note: Depending on the type of data contained in the selected field, the Ramp Editor might display two types of ramps: stepped and smooth.
- Select a Classification Method and # of Classes. Based on your choices, the Review and Modify Classes table populates with the size, value, and label for your classified data field. (See Tips on Classifying Data below for definitions and tips.)
Note: Classification Method and # of Classes do not apply to smooth ramps. They are grayed out.
- In the Review and Modify Classes table, you can change the size of the line width assigned to your classes, click a value to edit it, or type a label for any data value. (The Legend displays your label instead of the value.)
Tip: It is best practice to limit line width to a size range of no more than 1 - 12.
To apply your classification scheme, click the OK button at the bottom of the Ramp Editor. The Line Width button in the Style Editor displays your selected ramp.
|
 |
Tips on Classifying Data
This section provides definitions and tips to help you optimize your data classification. The Classification Method and # of classes that you chose for your data can affect the outcome of your analysis.
Classification Method
There are four types of classification methods:
Natural Breaks
- Divides data into classes based on natural breaks in the data distribution
- Calculates groupings of data values based on data distribution and seeks to reduce variance within groups and maximize variance between groups
- Limitation: Class ranges are specific to the data set, so it is difficult to compare a map with another map and to choose the optimum # of classes, especially if the data is evenly distributed
Distinct
- The only classification method for fields containing text
- Creates a separate class for each unique value in the data set
- Limitation: if you have a large number of unique values in your data set, your thematic map will be difficult to interpret due to too many different symbols/colors
Quantile
- Divides a data set that divide into "n" groups, containing (to the extent possible) equal numbers of observations
- Desirable in that this method produces distinct map patterns and minimizes the impact of skewed data
- Highlights changes in the middle distribution values because the intervals are generally wider at the extremes
- Limitation: areas with similar values can end up in different classes while areas with very different values can end up in the same class
Equal Interval
- Simplest method for classifying data
- Divides a set of data values into groups each of which represents the same range of values
- Better communicates trends with continuous sets of data. Works well with familiar data ranges such as percentages or temperature.
- Limitation: not good for non-normally distributed data sets because you might get a map with many features in 1 or 2 classes and some classes with no features
# of Classes
It is the best practice to select 5 to 7 classes for a step ramp. If you select too many classes for a step ramp, it may be difficult to gain insight from the color style on the map. If you would like to visually differentiate a wide range of values, use a smooth color ramp.
|
|
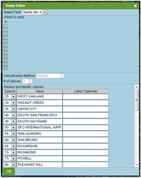
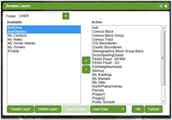
Adding Layers to the Legend
The Browse Layers window enables you to load your data into LandVision™, and add your new layers to the Legend. Once in the Legend, you can use Thematic Mapper to format and display your new layers.
Here's how to add your new layers to the Legend:
- After you load one or more data sets, click on your new layer(s) in the Available list in the Browse Layers window. The example to the right displays two selected layers. To select more than one layer, while holding down the Ctrl key on your keyboard, click on each layer you'd like to select.
Tip: If your new layer is not in the Available list, select another folder from the Folder drop-down menu. Then re-select your original folder.
- Click the right arrow
 to move your selected layers to the Active list.
Tip: To remove any layer from the Active list, select it and then click the left arrow to move your selected layers to the Active list.
Tip: To remove any layer from the Active list, select it and then click the left arrow  . .
- Click the OK button. LandVision™ adds your new layers to the list of all active layers in the Legend. (You may have to scroll down the Legend to see your new layers.)
|
 |
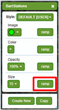
Creating a New Style
Here's how to create a new style:
- Click the Options icon to the right of your layer name in the Legend.
- Click Edit Style in the menu. The Style Editor opens.
- Click the Create New button
 at the bottom of the Style Editor. at the bottom of the Style Editor.
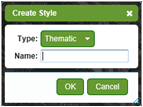
- Enter a name for your style in the Create Style window. The style name does not support special characters. It supports upper and lower case letters, spaces and underscores.
- Do not change the default style Type. It is Thematic.
- Click the OK button. Your new style name appears in the Style drop-down menu. You can now format the visual attributes of your new style.
|
|
Copying a Style
Here's how to copy a style:
- Click the Options icon to the right of your layer name in the Legend.
- Click Edit Style in the menu. The Style Editor opens.
- Click the Copy button
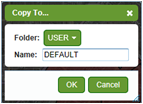
 at the bottom of the Style Editor. The Copy To... window opens. at the bottom of the Style Editor. The Copy To... window opens.
- Select the Folder to save the copy of the style.
- Enter a new Name for the style. You must change the name of the original style to copy to the folder it is saved in. The style name does not support special characters. It supports upper and lower case letters, spaces and underscores.
Tip: Select another folder if you would like to save a copy of the original style without changing its name.
- Click the OK button. The copy of the style appears in the Style drop-down menu. You can now format the visual attributes of the style if desired.
|
|
Creating a Label Layer
Here's how to add labels to your layer:
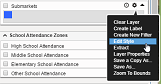
- Click the Options icon to the right of your layer name in the Legend.
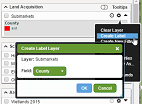
- Click Create Label in the menu.
- Select a Field from the drop-down menu that contains the values you would like to appear on the label(s). In the example to the right, the values of the Neighborhood field are the names of neighborhoods.
- Click the OK button. The map displays the label(s), and the Legend displays the label layer.
Tip: To ensure your labels display properly, make sure the label layer is listed above your corresponding data layer. You can reorder layers in the Legend by dragging and dropping to the desired position.
|

|
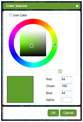
Tips for Using the Color Selector
The Color Selector works the same for both Fill Color and Line Color, except that the opacity setting does not apply to Line Color. Each color has Red, Green, and Blue (RGB) values. The values range from 0 to 255. Fill Color has an Alpha value for opacity. Opacity value ranges from 0.0 (clear) to 1.0 (solid color). A color with 0.0 opacity is not visible on the map.
Tip: If you want to use the exact same color more than once, it is best practice to write down its RGB values. For Fill Color, also write down the Alpha value for opacity. In the Color Selector window, enter the values in the appropriate fields.
- To pick a color using the Color Wheel, click on the wheel. To change the shade of the color, move your mouse in the box inside the wheel.
- To select the opacity for Fill Color only, move the slider.
|
|
Related Information
|