LANDVISION 8.16 RELEASE
|
LandVision
Help >
What's New > 8.16 Release
|
|
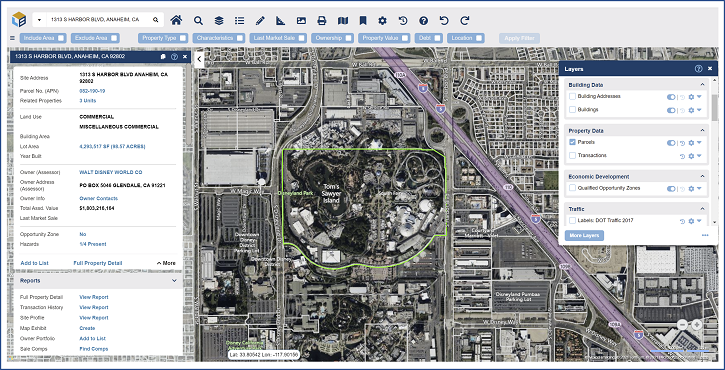
Welcome to the 8.16 release of LandVision! With this release we’re thrilled to unveil a new look and feel for LandVision that offers a fresh new interface while preserving all the features and data you’ve come to rely on for your property analysis. Fresh new look, no learning curve!
And no LandVision release would be complete without new data and maps to drive a deeper understanding of properties and markets. A few highlights of our expanded offering are:
- Building Footprints and Addresses
- Expanded risk data for Seismic Features and Florida Sinkholes
- USGS Topographic Base Map
- Property Flood Risk Report
Keep reading below for more details on what's new in LandVision and for links to additional information on how to get the most out of these new features.
|
Exciting New Look, Same Great Features
|
8.16 brings with it a new look and feel for LandVision. With streamlined toolbars, updated colors, and a modern esthetic, LandVision is better than ever. And don’t worry about learning a new interface – aside from some very minor changes detailed below, all features and data have the same locations and behavior. Read below for notable UI changes:
|
Main Toolbar
- Tool names are available via mouse over
- Home button is now to the right of the Locate box
- List, Quick Measure and Map Views Toolbar features have new icons – same feature, new look
- Toggle Fullscreen feature moved under the Advanced Menu
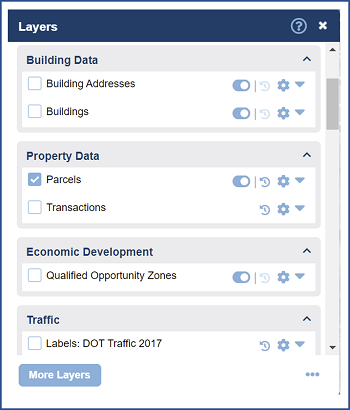
Layers Panel
- Streamlined and reorganized Panel Actions (buttons)
- More Layers button moved to the bottom left of the Panel
- Save and Open options moved to the More option to the bottom right of the Panel
- Change Settings button removed (obsolete functionality)
Information Panel
- Expand/Collapse Button moved from the left of the Panel Cards to the right
|
|
|
Visit the links below to learn more about this feature:
LandVision Interface | Property Information Panel | LandVision Toolbar
|
|
Expanded Property and Risk Data
|
Data is always on our minds here at LandVision, and as our parent company, LightBox, grows and expands, so does our data offering in LandVision.
|
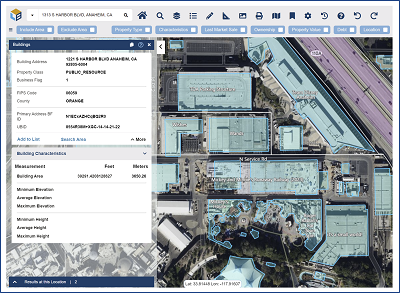
Buildings and Addresses
LandVision property data got a major upgrade with the addition of nationwide Building Footprints, building attributes like Height and Elevation, and Address Points. Building footprints provide greater context for the nature of improvements on a property and their general layout. In some areas you can also access key building information like height (min, max, avg) and ground elevation (min, max, avg).
Look for these layers in the Building Data section of the Layers Panel and linked into the Summary Card of the Parcel Panel.
|
|
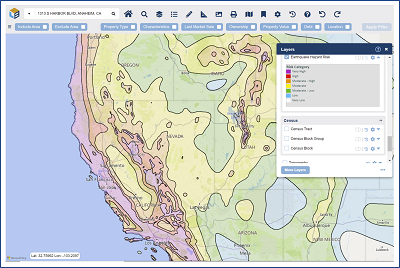
Seismic and Sinkhole Hazards
USGS Earthquake Hazard Risk and Fault Lines layers help you better understand seismic risk surrounding properties and markets. Also new is a Sinkhole locations layer for the State of Florida. Not only are these layers super informative, but we personally think the Earthquake Risk layer makes quite a beautiful map, especially when viewed over the Road Base Map!
Look for these layers in the Hazards section of the Layers Panel.
|
|
USGS Topographic Base Map
We know our users love topographic maps, so we’re thrilled to introduce a new Topo Base Map option from the USGS. The multi-scale topographic reference map is comprised of the most current data in The Nation Map (TNM). In addition to contours, it also has street references, water features, and select points of interest. We think it’s best viewed by turning off the other Base Map options (e.g. Road, Aerial, Aerial w/Labels) and then layering on other data as needed. Enjoy!
Note: If you don’t see these new layers in your Layers Panel, there may have been a glitch when we automatically added them to your user. If so, simply open and save the Production Home Map View. To do this: 1) go to the Layers Panel, 2) click the More Icon from the lower right of the Panel, 3) select Open, 4) select “Production” from the Folder drop down, and 5) select Home, from the Map Views list. To make this your default Map View so you see the new layers each time you log in, save the Map View by 1) clicking the More Icon from the lower right of the Panel, 2) selecting Save and enter “Home” for the Map View name.
|
|
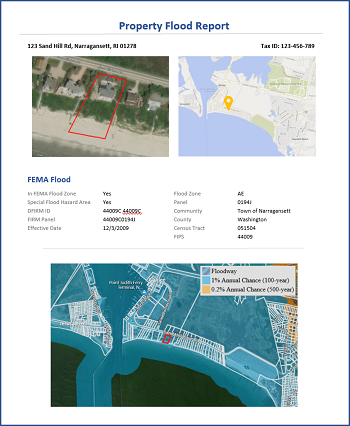
New Property Flood Report
|
You asked, and we listened! We’ve had several requests for expanded reporting options around our popular FEMA Flood data set. With 8.16, we’ve added a new Property Flood Risk Report to the Reports card of the Parcel Panel*. This report expands upon the Flood information provided in the Site Profile report and offers additional map images of the property.
Note: If you don't see the new Flood Risk Report option in the Parcel Panel Reports Card, you might have a custom Parcel Card. To reset your card and get the new report, simply click the "Card Designer" command from the "More" dropdown at the bottom of the Summary Card. Wait for the card to load and click "Reset."
*Available for BDE and CRE Editions
Visit the links below to learn more about this feature:
Property Information Panel
|
|
|
|