
|

|
GOVCLARITY SUMMER 2017 RELEASE
| GovClarity® Help > What's New > GovClarity Summer 2017 Release | ||
|
Welcome to the Summer 2017 release of GovClarity. With this release comes:
Keep reading below for more details on what's new in the GovClarity Summer 2017 release and for links to additional information on how to use these new features. |
||
|
||
| ||
Simplified Access to Information | |
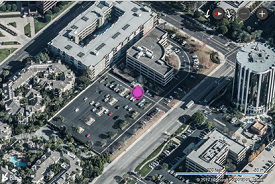
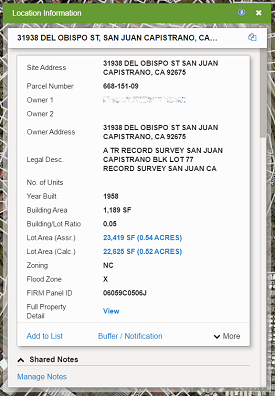
New Location Information PanelTo simplify information presentation, we redesigned the balloons to a new Panel and Cards Interface. The result is you no longer need to look on multiple balloons to find information, all of your layer information is on the Panel. In response to your feedback, we re-organized the Commands and they are located on the cards that match the command functionality. Visit the link below to learn more: Location Panel |
 |
|
| |
Comparison Panel | |
|
GovClarity includes detailed national parcel and property data coverage, including recent sales transaction information. In this release, we've greatly expanded our sales transaction data across the country, bringing the total number of counties providing continuous sales transaction updates to over 2000. Working with a Fortune 500 partner, we process the latest sales transaction data as soon as it is available, thus enabling our clients to consistently access the most current information in GovClarity. Visit the link below to learn more: Copy to Compare |
|
| |
Panel Profiles & Card Designer | |
|
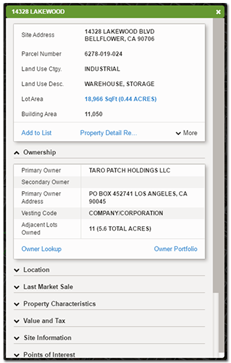
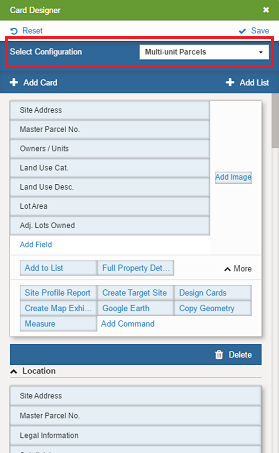
Panel Profiles are also new in this release. We reviewed the property information and in this release, introduce different Panels based on land use. If there's something missing that you need to see, that's where Card Designer will help. Many of our customers use GovClarity in different ways and we support that! Each user can customize the individual Panel Profiles, or share the map composition with those Panel Profiles. Check out our Panel Profiles and make GovClarity work for your unique needs today with Card Designer! Visit the link below to learn more: Card Designer |
 |
|
| |
Tooltips | |
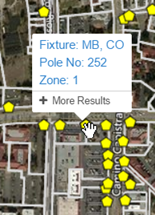 |
Tooltips make map navigation and decision making faster and easier. Hover your mouse over a parcel or other layer feature such as; a zoning polygon, a storm water line, or a business point to display the tooltip with details relevant to you. The information displayed in the Tooltip is layer specific and editable. Find information like never before with GovClarity's new Tooltips! Visit the link below to learn more: Tooltips |
|
| |
Feature Identify Updates | |
|
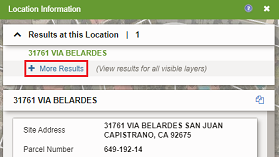
We've made it easier to identify properties and features on the map. You no longer need to set a layer "identifiable". All properties and features can be identified by selecting them on the map through the Tooltip, or by selecting More Results from the bottom of the tooltip. Also, the More Results link has been moved to the top of the Location Information Panel, so you can view other features in the area as well. Visit the link below to learn more: Tooltips |
|
Understand the Data with Our New Heatmaps! | |
|
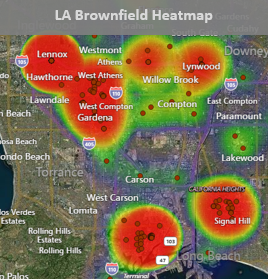
Get a better understanding of the density of data in your area with our new Heatmap command. Generated from any layer, this command will create a second layer that allows for a quick assessment and quantification of information.
Visit the link below to learn more about this feature: |
|
|
|
General Usability | |
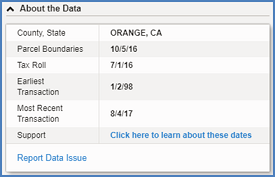
New About the Data CardPresented as a card for every property, About the Data provides the following information:
About the Data |
|
Updated Results List OptionsYou've asked for it and we're delivering. Prior to the implementation, the Results List had to be removed in order to see the properties that were covered by numbers. With this new implementation it can be done (while retaining the highlight) without removing the results list.
Visit the link below to learn more about this feature: |
TimeView Has A New HomeOne of our most popular premium features, TimeView, can now be found in the Toolbar. Using this command will now generate a movable window to allow for easy access when viewing changes to your market over time. 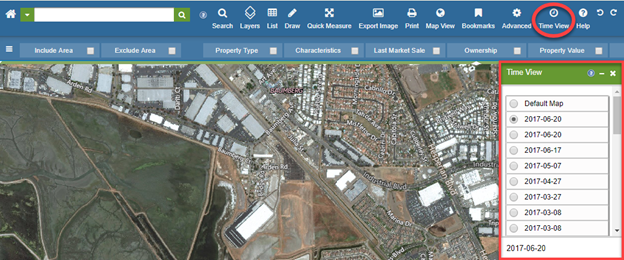
Visit the link below to learn more about this feature: |
Integrate Your ArcGIS Server Hosted Data | |
|
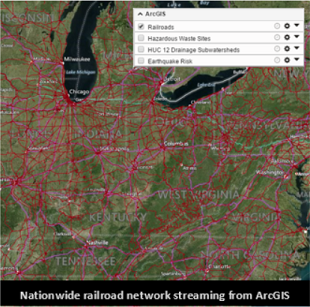
Introducing GovClarity's Integrated Esri Feature Layers, the solution for customers who would like to include Feature Layers located on your Esri servers in your GovClarity subscription. Now you can easily integrate layers from your Esri server, whether on premise or in the cloud, to GovClarity.
Visit the link below to learn more: Integrated Esri Feature Layers |
 |
|
Note: The Integrated Esri Feature Layers is an add-on for GovClarity products. Contact your Account Manager for more information if you are interested in this new capability. |
|
Data Updates | |
|
And while you may need to wait for a release to experience our powerful new features, data updates are always being processed and published to GovClarity. As a GovClarity subscriber you get a continuous stream of new and refreshed data. For example:
|
|
| © Copyright 2018 Digital Map Products | About DMP | Contact Us |