|
LandVision
Help >
What's New > Winter '18 Release
|
|
Welcome to the Winter '18 release of your LandVision Edition. With this release comes:
- Reports: Improved Content, Layout, & Interactivity
- Tools to Better Understand Your Market
- General Usability Improvements
- Data Updates that you've experienced over the past few months
Keep reading below for more details on what's new in the LandVision Winter '18 release and for links to additional information on how to use these new features.
|
Reports: Improved Content, Layout, & Interactivity
Site Profile report
The Site Profile Report has received numerous updates, a new layout, and new interactive maps! These updates include the following:
- The Site Profile Report now generates more rapidly and efficiently.
- The demographics section now includes ten new sections to give complete understanding of the surrounding market.
- The changes to the Property Detail Report will also be reflected in the one found in the Site Profile Report.
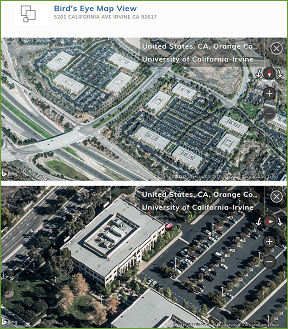
- Microsoft Bing Obliques are now two interactive images, providing the ability to find the best representation of the subject property without ever leaving the report.
Site Profile Reports are only available in the LandVision Builder Developer and Commercial Real Estate Editions.
Visit the links below to learn more about this feature:
Site Profile Report | Property Detail Report | Demographics | Streetside View
|
|
|
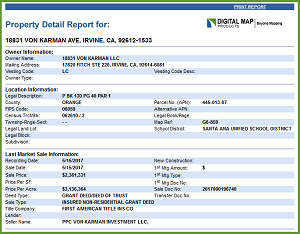
Property Detail Report
The Property Detail Report also received updates to the underlying data and the format of the report itself. The changes include the following:
- Improved coverage of the information within the report.
- The introduction of the Prior Sale and Hazards sections.
- Over thirty new fields in the new and previously existing sections.
Visit the link below to learn more about this feature:
Property Detail Report
|
|
Tools to Better Understand Your Market
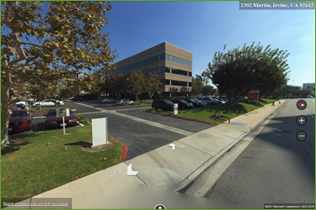
Bing™ Streetside Imagery
Generated by right-clicking on the map, Bing Streetside imagery provides interactive street level view of the property and the surrounding area. Leverage this new tool to quickly gain insight into the state of the building on that property or the neighboring tenants at a retail site.
Visit the link below to learn more about this feature:
Bing Streetside View
|
|
|
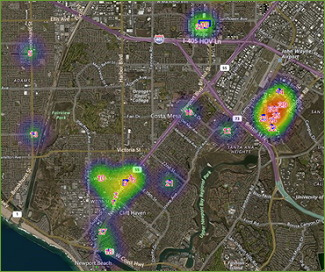
Heatmap Improvements
We introduced the Heatmap capability in the Summer release with the ability to create one from a layer. With this release we've improved upon that capability by allowing you to quickly analyze an area to understand where properties are transacting, retail locations are densely concentrated, or hazards may impact a purchase decision. Navigate to the Results Lists commands and click on the new "Create Heatmap" command today to visualize the density of your Results List on the map.
Pictured: Office and retail locations that have transacted in the past three months.
Visit the links below to learn more about this feature:
Heatmaps | Results List
|
|
General Usability Improvements
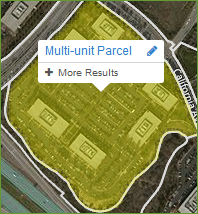
Tooltip Enhancements
We've taken the feedback from our users and made the following enhancements to ensure an easier and better experience when working with Tooltips:
|
About the Data Now on Demographics and Points of Interest
With the Winter release comes some additional information about the data. Now information about when the data was last updated will be displayed when identifying a Demographics block group or a Point of Interest.
The Demographics and Points of Interest datasets do not come standard in all versions of LandVision. If you would like to add these datasets please contact Support or your Account Manager.
|
Other General Enhancements
- Microsoft Edge is now a Supported Browser
- A new rectangle draw tool has been introduced
- The numbers relating to the Results List can now be styled from the Results List options
Visit the links below to learn more about this feature:
System Recommendations | Drawing Tools | Editing Results List Style
|
|
Data Updates
|
While our customers have been awaiting the latest release of LandVision, they have already had the benefit of experiencing the following updates:
- Over 2.4 million new parcels totaling over 99 new counties have been added into the LandVision application platform in the past twelve months!
- DMP has sourced, secured, and processed parcel geometry updates from Counties covering over 83 million parcels in just the past twelve months.
- Tax information has been updated for over 2,500 counties.
|
|
|
|
|
© Copyright 2018 Digital Map Products
|
|